“Changes in under-ice thermocline properties from the sea ice expansion period (September 2007–August 2016) to the retreat period (September 2016–December 2024), defined by vertical red lines in Fig. 1. Credit: Proceedings of the National Academy of Sciences (2026). DOI: 10.1073/pnas.2530832123“
WHEN ANTARCTICA is HOT
https://phys.org/subsurface-triggered-antarctica-sudden-sea
https://phys.org/news/2026-03-basically-entire-hot.html
Gigantic ‘Heat Dome’ Baking The Whole US May Be Historic, Scientists Say
by SETH BORENSTEIN / 24 March 2026
“After smashing March heat records in 14 states and the U.S. as a whole, the gigantic heat dome that’s baked the Southwest is creeping eastward and may end up being one of the most expansive heat waves in American history, meteorologists and weather historians said. And it’s not going away for awhile, maybe not till the middle of the next week as April starts, said meteorologist Gregg Gallina of the National Weather Service’s Weather Prediction Center. “Basically the entire U.S. is going to be hot,” Gallina said Monday. “The area of record temperatures is extremely large. That’s the thing that’s really bizarre.” This heat dome – in which high pressure is acting like a pot lid trapping hot air over a region – will leave Flagstaff, Arizona, with 11 or 12 straight days of temperatures higher than the city’s previous March record, said meteorologist Jeff Masters of Yale Climate Connections.
Gallina said the dome’s eastward movement will mean temperatures in the 90s Fahrenheit (mid-30s Celsius) by Wednesday over the southern and central plains. From one-quarter to one-third of the 48 continental states will be flirting with records for March, Gallina said. The physical area of this heat wave likely dwarfs two other historic heat waves – one in 2012 in the Upper Midwest and Northeast and another in 2021 in the Pacific Northwest – according to weather historian Chris Burt, author of the book “Extreme Weather.” It may not be as large as the Dust Bowl heat waves of 1936, but that was a series of heat waves over two months during summer, not a single big event like now, Burt said. Both the Dust Bowl and the 2021 heat wave were more intense, with higher temperatures that hurt people more because they fell in June and July, Gallina said. Another saving grace for people in this heat wave is that it’s not as humid as it would be if the temperatures rose in the summer, Gallina said.
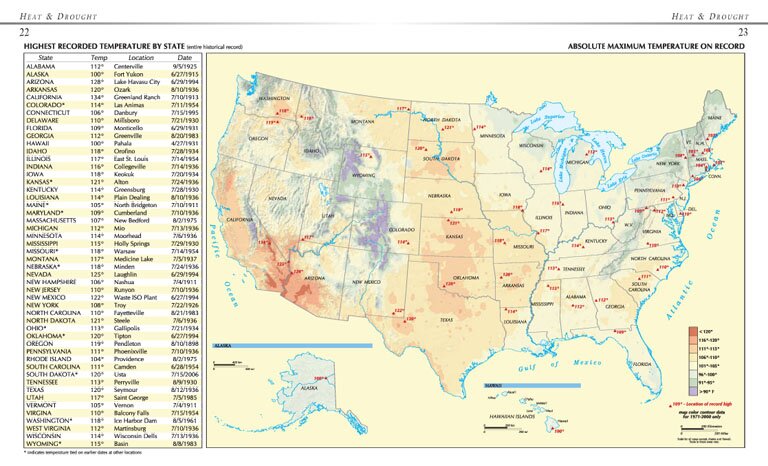
On Friday, four places in Arizona and California hit 112 degrees (44.4 degrees Celsius), according to the Weather Service. Not only did that smash the record for the hottest March day in the continental United States by 4 degrees (2 degrees Celsius), but it was only 1 degree shy of the hottest day recorded in the Lower 48 in April. Climatologist and weather historian Maximiliano Herrera, who tracks global weather records, compiled a list of 14 states that have notched their hottest March day on record since this heat dome started: California, Arizona, Nevada, Kansas, New Mexico, Nebraska, Utah, South Dakota, Missouri, Iowa, Colorado, Wyoming, Minnesota and Idaho. “In Mexico, even May records were trashed with March records broken by as much as 14 (degrees Fahrenheit), far more than July 1936, March 1907 or June 2021,” Herrera wrote in an email.
The National Center for Environmental Information registered at least 479 weather stations breaking records for March from Wednesday through Saturday, based on its network of stations. Herrera, who analyzed a broader set of data, said the true number is likely higher. Another 1,472 daily records – which are easier to break – were shattered at the same time, the center said. What’s happening is the jet stream – which moves weather systems from west to east – is pretty much stuck as far westward as the storms dousing Hawaii, where people are seeing torrential rains and flooding, Masters and Gallina said.
On Friday, a group of international climate scientists called World Weather Attribution determined that the record heat was “virtually impossible” and 800 times more likely because of climate change from the burning of coal, oil and natural gas. The result of those activities added at least 4.7 degrees (2.6 degrees Celsius) to the heat, said report co-author Clair Barnes, an Imperial College of London scientist with the group. The heat dome will move on by late next week, Masters said: “We just have to give it time.”
MAXIMUM SOLAR ACTIVITY
http://gorbanev.com/Solar_article.pdf
https://mpra.ub.uni-muenchen.de/123402/1/MPRA_paper_123402.pdf
Extraordinary Economic and Social Events Associated with the Solar Cycle Maximum
by Gorbanev, Mikhail (2025)
Abstract
The currently unfolding solar cycle 25 reached its maximum on or about October 2024. According to long-standing theoretical claims, cyclical maximums of solar activity could be associated with economic recessions (W.S.Jevons), revolutions and migration (A.L.Chizhevsky). And indeed, several of such extraordinary events have already occurred recently. These include revolutions in Bangladesh (2024), government collapse in Syria (2024), Hamas terrorist attack on Israel (2023), and student protests in the US and Europe against the war in Palestine (2024). Meanwhile, migrant influx overwhelmed the US and Western Europe. Are we going to see more of the extraordinary events typically associated with the solar maximums, such as revolutions in a few more countries colliding in a revolutionary wave like the Arab Spring of 2010-12 or collapse of Communism in 1989-91? Or economic recessions in the US and other advanced economies leading to a global economic slowdown?”
INTRO to HELIOBIOLOGY
https://spaceweatherlive.com/en/solar-activity/top-50-solar-flares
https://portal.fmed.uniba.sk/articles.php?aid=192
Solar activity, revolutions and cultural prime in the history of mankind
by Miroslav Mikulecký / 28.3.2012
“Russian scientist Tchijevskij investigated almost 100 years ago (suggested for Nobel prize) relationships between solar activity, cycling with the period around 11 years, and the status of mankind. He found „social excitation“, as revolutions and wars, at the time of solar maxima and peaceful activities like flourishing of arts at minima.The present paper explores whether such a parallelism applies also to the 500 years´ (semimillenial) cycling of solar activity. The present author obtained, using the cosinor analysis, significant positive anwer. It is hypothesized that one of the responsible factors could be solar impact on geomagnetic field.
Neuroendocrinol Lett 2007,28 (6):749-756.
Solar activity, revolutions and cultural prime in the history of mankind
MASS HUMAN EXCITABILITY
https://helioeccentrictheory.com/alexander-chizhevsky/
https://archive.org/details/pdfy-vYAulJlSu_O5kESO
Interaction Between The Sun And Human Excitability
“During World War I, A. L. Tchijevsky, a Russian professor of Astronomy and Biological Physics, noticed that particularly severe battles followed solar flares during the sunspot peak period of 1916-17. Intrigued by the connection of human behavior to solar physics, Tchijevsky constructed an “Index of Mass Human Excitability”. He compiled the histories of 72 countries from 500 BC to 1922 AD to provide a database to articulate his correlations. After rating the most significant events, Tchijevsky found that fully 80% of the most significant human events occurred during the 5 years or so of maximum sunspot activity.”
SURE IS HOT
https://helioforecast.space/solarcycle
https://sciencealert.com/solar-maximum-happening-now
It’s Official: NASA Declares The Solar Maximum Is Happening Now
by Michelle Starr / 17 October 2024
“Brace yourselves, Earthlings: NASA, the NOAA, and the Solar Cycle Prediction Panel have officially declared that solar maximum is now underway. What does that mean? Our Sun is reaching the peak of its 11-year activity cycle, a time when sunspots, solar flares, and coronal mass ejections are rampant. So we’re going to continue to see a lot of ruckus from the Sun in the months ahead. At some point amid all this ballyhoo and brouhaha, the Sun’s magnetic poles will switch places and activity will start to subside, heading towards the lull in the solar cycle known as solar minimum. But we’re not going to know when precisely this will occur until solar maximum is long over. “This announcement doesn’t mean that this is the peak of solar activity we’ll see this solar cycle,” says meteorologist Elsayed Talaat of NOAA. “While the Sun has reached the solar maximum period, the month that solar activity peaks on the Sun will not be identified for months or years.”
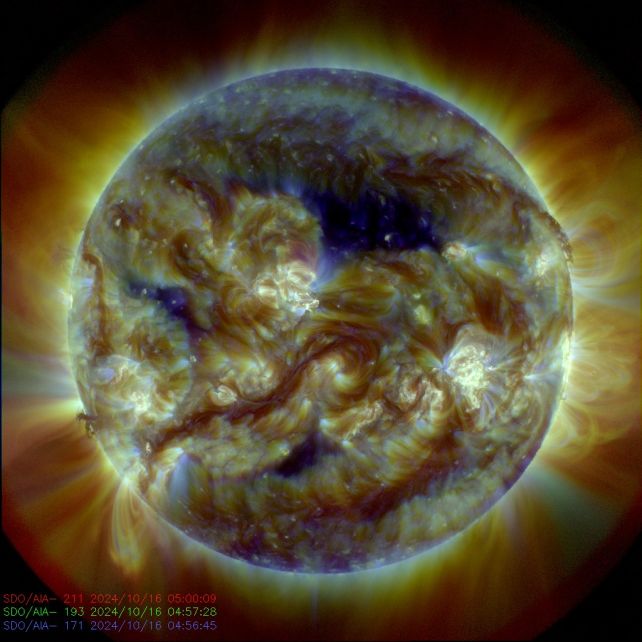
“The Sun on 16 October 2024 in 171, 193, and 211
angstrom wavelengths. (NASA SDO)”
The Sun is a dependable presence in our lives, and that’s good news for us because it’s vital for our very existence on this planet. But that doesn’t mean the Sun is intrinsically constant: our star undergoes changes of its own, one cycle of which is the 11-year activity cycle. We don’t know much about what drives these cycles, to be honest: figuring out what’s happening inside the Sun is actually pretty hard to do. And although each cycle is roughly 11 years long, they vary in exact length. Precisely how long isn’t something we can predict with any certainty, nor how strong it will be, or even when maximum and minimum are due to take place. “We can’t reliably predict solar cycles,” solar astrophysicist Michael Wheatland of the University of Sydney, Australia told ScienceAlert in 2022. “We don’t completely understand the solar dynamo, which generates the magnetic fields seen at the surface as sunspots, and which produce flares. This is one of the outstanding problems in astrophysics.” But we do know how a solar cycle manifests, and solar scientists and meteorologists can use those manifestations to track the cycle. The key metric is sunspots – regions on the surface of the Sun where the magnetic field is temporarily extra-strong and tangled, inhibiting the flow of hot plasma, which makes the region cooler and darker than the surrounding solar surface.
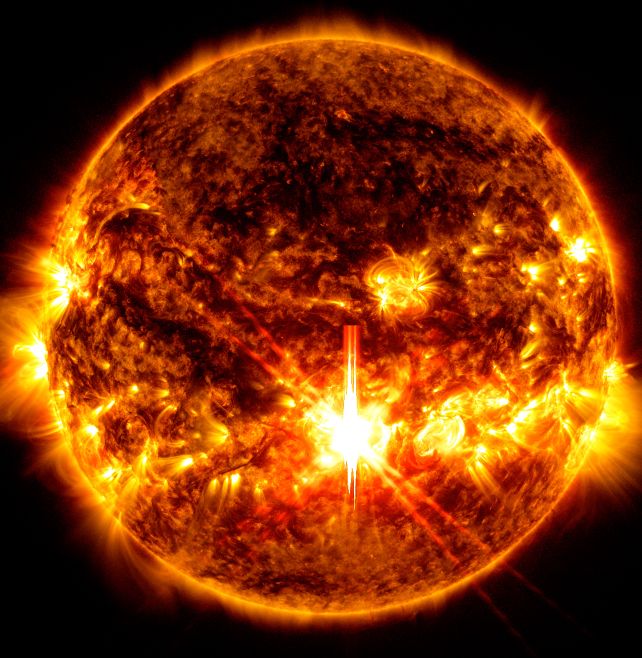
X9.0 flare (NASA SDO)
Solar minimum is when sunspots are at their fewest. Solar maximum is when sunspots speckle the surface like freckles across a sunkissed nose. And with them come huge solar outbursts. When the tangled magnetic field lines in sunspots snap and reconnect, they erupt in powerful bursts of light and energy; those are solar flares. And sometimes they also violently expel billions of tons of solar particles and magnetic fields, rocketing through the solar system; those are coronal mass ejections. Both phenomena can have an effect on Earth. Solar flares can result in radio blackouts. Coronal mass ejections, when they slam into the magnetic field shielding Earth, beget a phenomenon known as geomagnetic storms. These can be more hazardous, generating currents that can interfere with power grid operations, impede communication and navigation, and infringe upon satellite operation. But they also produce stunning auroras as the solar particles interact with particles in Earth’s upper atmosphere. That’s why we’ve been seeing so many aurora events this year.
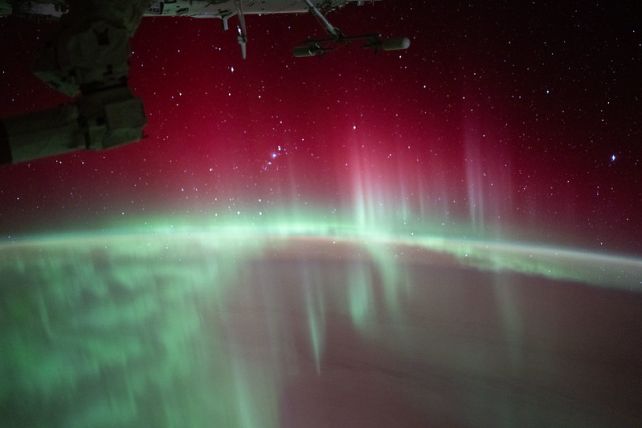
Aurora photographed from the International Space Station in 2024. (NASA Johnson)
But we’re not in danger, as far as we can tell. It’s true that the current solar cycle is significantly stronger than the initial predictions made by NASA and the NOAA, but it’s not the strongest solar cycle that we’ve ever seen, and it’s still within normal limits. The most powerful flare of the current cycle was an X9.0 that erupted on 4 October, and while that sits within the top 20 ever measured, there are some absolute monsters on that list that you probably didn’t even notice. Meanwhile, some interesting analysis is yet to be done. While the official predictions about the solar cycle were lower than what took place, some scientists did predict a strong cycle, with much more accuracy. This could have some pretty interesting implications for our understanding of how the Sun works, and the models we use to predict solar cycles in the future…”

SOLAR POLAR FIELD REVERSALS
https://aanda.org/articles/aa/full_html/2018/10/aa32981-18/aa32981-18.html
https://sciencealert.com/the-new-sunspot-cycle-could-be-one-of-the-strongest-we-ve-ever-recorded
Our Sun Has Entered a New Cycle, And It Could Be One of The Strongest Ever Recorded
by Michelle Starr / 08 December 2020
“The Sun may be in for a very busy time. According to new predictions, the next maximum in its activity cycles could be one of the strongest we’ve seen. This is in direct contradiction to the official solar weather forecast from NASA and the NOAA, but if it bears out, it could confirm a theory about solar activity cycles that scientists have been working on for years. “Scientists have struggled to predict both the length and the strength of sunspot cycles because we lack a fundamental understanding of the mechanism that drives the cycle,” said solar physicist Scott McIntosh of the US National Center for Atmospheric Research. “If our forecast proves correct, we will have evidence that our framework for understanding the Sun’s internal magnetic machine is on the right path.”

The Sun’s activity levels are actually quite variable, and its activity cycles are bound up with its magnetic field. Every 11 years, the Sun’s poles swap places; south becomes north and north becomes south. It’s not clear what drives these cycles, but we do know that the poles switch during solar maximum, when the magnetic field is at its weakest at the poles. Once the poles have switched, the magnetic field weakens, and solar activity decreases, before rising again ahead of the next polar switch. Because the Sun’s magnetic field controls its activity – sunspots (temporary regions of strong magnetic fields), solar flares, and coronal mass ejections (produced by magnetic field lines snapping and reconnecting) – a low magnetic field across the surface of the Sun is called the solar minimum. Generally, we track solar minima by keeping a careful eye on solar activity and working out after the fact that one has occurred. By this metric, the most recent solar minimum took place in December 2019.
We’re now in the 25th solar cycle since record-keeping began, headed into a solar maximum. According to NASA and the NOAA, this is expected to be a quiet maximum, with a sunspot peak of around 115 sunspots in July 2025. This is pretty similar to Solar Cycle 24, which had a sunspot peak of 114. But McIntosh and his colleagues believe differently. In 2014, he and his colleagues published a paper describing their observations of the Sun on a 22-year cycle. This has long been considered the full solar cycle, when the poles return to their starting positions, but McIntosh noticed something interesting. Over the course of about 20 years or so, flickers of extreme ultraviolet light called coronal bright points seem to move from the poles towards the equator, meeting in the middle. The movement of these bright points across the mid-latitudes seems to coincide with sunspot activity.
 (Scott McIntosh/NCAR)
These bright points, McIntosh believes, are linked with bands of magnetic fields that wrap around the Sun, propagating from the poles to the equator every 11 years or so. Because they have opposite polarity, when they meet in the middle, they cancel each other out – what the researchers call a “terminator”. These terminator events mark the end of a solar magnetic cycle, and the start of the next. But they don’t always take exactly the same amount of time. Sometimes these bands slow down as they reach mid-latitudes, which means that the length of time between terminator events varies. And the team noticed that there’s a correlation between the length of time between terminators and the intensity of the following solar maximum. “When we look back over the 270-year long observational record of terminator events, we see that the longer the time between terminators, the weaker the next cycle,” said astronomer Bob Leamon of the University of Maryland Baltimore County. “And, conversely, the shorter the time between terminators, the stronger the next solar cycle is.”
The longest cycle on record based on time between terminators is Solar Cycle 4, which lasted over 15 years. It was followed by the famous Dalton minimum – a peak of just 82 sunspots in Solar Cycle 5, which lasted nearly 14 years, and 81 sunspots in Solar Cycle 6. But shorter solar cycles – those that are less than 11 years – are followed by maxima with peaks well above 200 sunspots. Solar Cycle 23, according to McIntosh’s team’s metric, was pretty long. It lasted nearly 13 years. And Solar Cycle 24 was much quieter than the cycles that preceded it. But it was also really short, coming in under the 10-year mark. If the team’s analyses are in point, we should be in for a lot of sunspots by the mid-2020s. There’s only one way to find out – we have to wait and see. But McIntosh and his team are confident in their interpretation of the Sun’s activity. And, if they’re right, that will give us a whole new toolset for understanding how the Sun works. “Once you identify the terminators in the historical records, the pattern becomes obvious,” McIntosh said. “A weak Sunspot Cycle 25, as the community is predicting, would be a complete departure from everything that the data has shown us up to this point.” The research has been published in Solar Physics.”
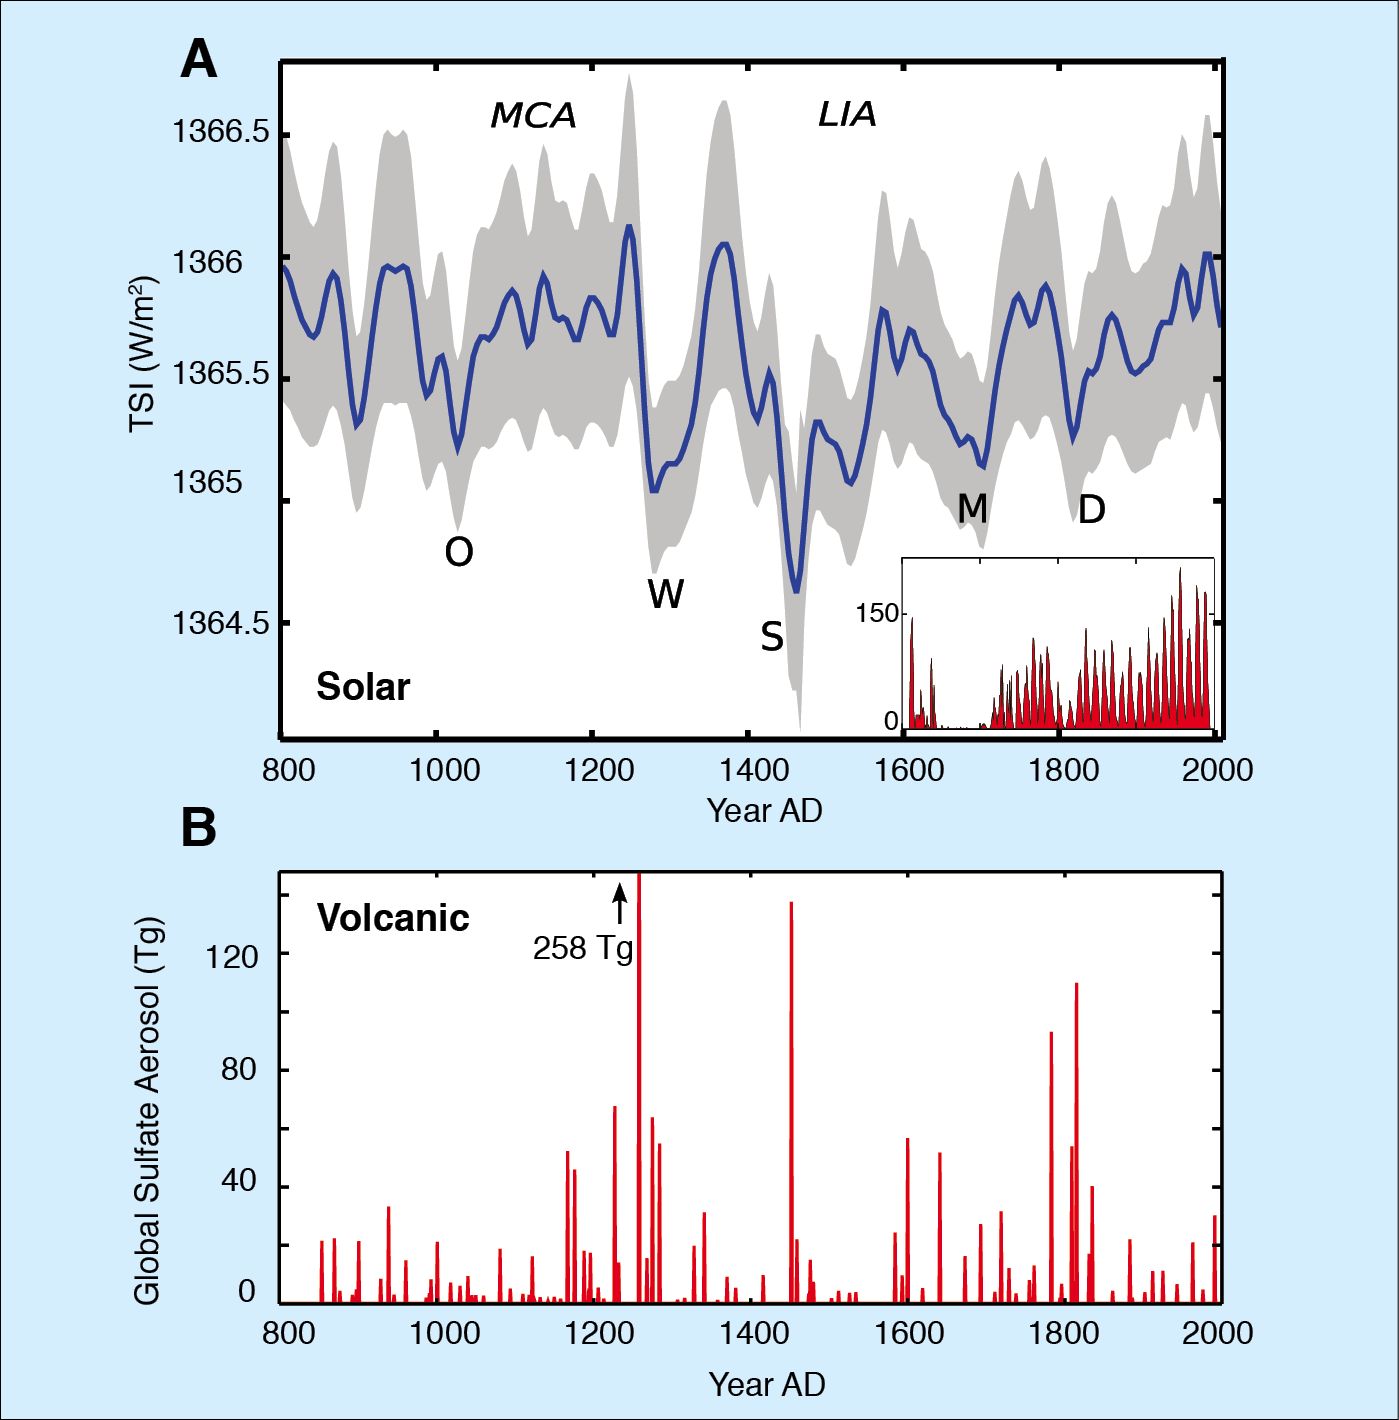
Figure 1: A) Zoom-in of the 9300-year long total solar irradiance (TSI) reconstruction (Steinhilber et al., 2009) for the past 1200 years. The gray band is the 1σ uncertainty. Inset shows the group sunspot number. MCA: Medieval climate anomaly; LIA: Little Ice Age. Capital letters mark grand solar minima: O=Oort, W=Wolf, S=Spörer, M=Maunder, D=Dalton. B) Total global stratospheric volcanic sulfate aerosol injection in teragram (Tg) (Gao et al., 2008).
MAKING SOLAR HISTORY, BABY
https://link.springer.com/article/10.1007/s41116-023-00036-z
https://pastglobalchanges.org/publications/pages-magazine/7503
Solar activity – the past 1200 years
by Friedhelm Steinhilber and Jürg Beer
Past Global Changes Magazine 19(1) 2011
https://doi.org/10.22498/pages.19.1.5
“The Sun is a variable star and the most important source of energy for the Earth. This raises the question whether the Sun affects the Earth’s climate. Several solar activity records show that the Sun has short- and long-term variability. An example is the well-known sunspot record (inset curve in Figure 1a), which reaches back to the year 1610 AD, when people started to use the telescope for astrophysical purposes such as observing the Sun. From the sunspot record it is known that solar activity was lower during the 17th and 18th century than today. In particular, the period from 1645 to 1715 AD named the Maunder Minimum (Eddy, 1976) is characterized by a nearly complete absence of sunspots. The sunspot record “only” goes back to 1610 AD and before this time other proxies of solar activity must be used. Presently the only proxies capable of extending the record of solar activity beyond 1610 AD are cosmogenic radionuclides, such as 14C and 10Be. The term “cosmogenic” points to the origin of the radionuclides — cosmogenic radionuclides are produced by nuclear reactions between cosmic ray particles and the gases of the Earth’s atmosphere. Thus, cosmogenic radionuclides record the intensity of the cosmic ray intensity at Earth.
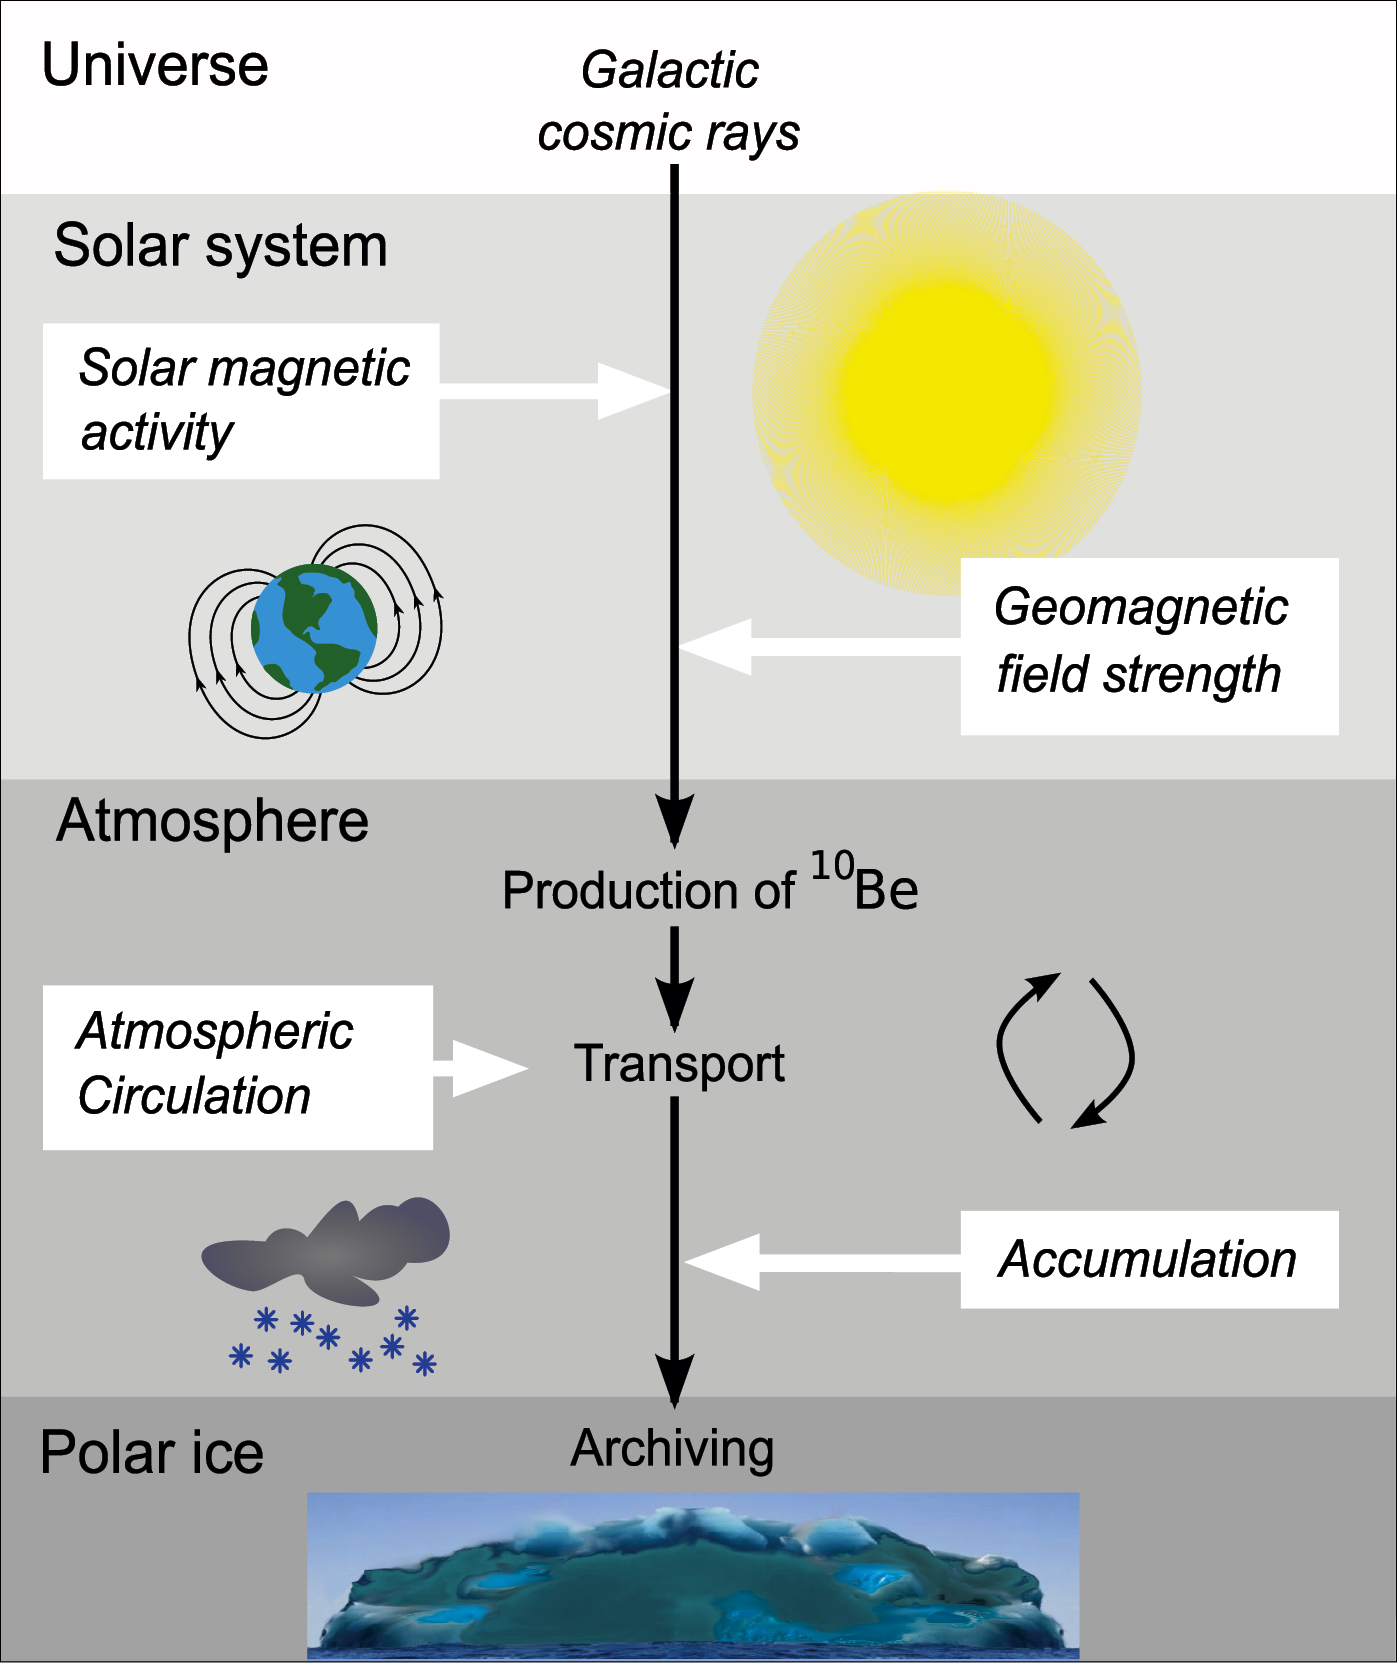
“Illustration of the 10Be system and its relationship to solar activity.”
Why do cosmogenic radionuclides record the solar activity? The link between 10Be and solar activity is illustrated in Figure 2. Cosmic ray particles are accelerated to high energies in the vicinity of supernova explosions in our galaxy. To reach the Earth they have to propagate through the heliosphere, which is formed by the solar wind carrying the solar magnetic field. Cosmic ray particles are charged and therefore get deflected by the solar magnetic field. The larger the strength of the solar magnetic field, the stronger is the deflection of cosmic ray particles and the lower the cosmic ray intensity at Earth. The solar magnetic field is directly related to solar activity, i.e., when solar activity is weak the strength of the solar magnetic field is weak. To summarize, the radionuclide production rate is high during a grand solar minimum like the Maunder Minimum and low during periods of high solar activity. Thus the radionuclide signal principally allows reconstructing solar activity.
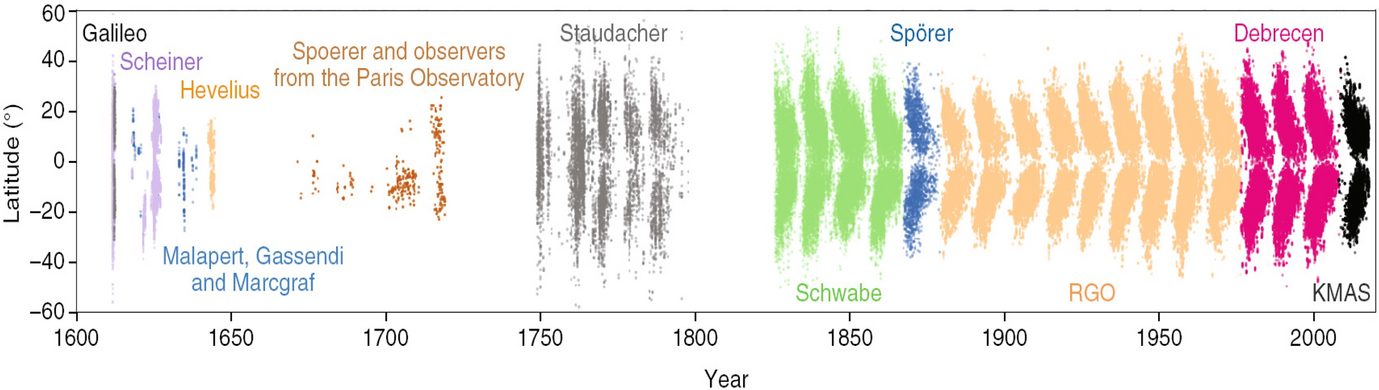
“Maunder butterfly diagram of sunspot occurrence reconstructed from different sources as compiled by Muñoz-Jaramillo and Vaquero”
In addition to the solar magnetic field, the geomagnetic field also modulates the cosmic ray intensity. From archeointensity data it is known that the geomagnetic field has varied in time (e.g., Knudsen et al., 2008) and therefore a part of the variation found in cosmogenic radionuclides is of geomagnetic origin. Hence, variations of the geomagnetic field must first be removed from the radionuclide record before solar activity can be calculated. The physics-based dependencies between radionuclide production, solar activity and geomagnetic field strength have been determined using the Monte Carlo technique (Masarik and Beer, 2009). These calculations provide the dependence of the radionuclide production on solar activity and geomagnetic field strength. Based on this dependence and the known paleo-geomagnetic field, the solar activity can be derived from the radionuclide signal.
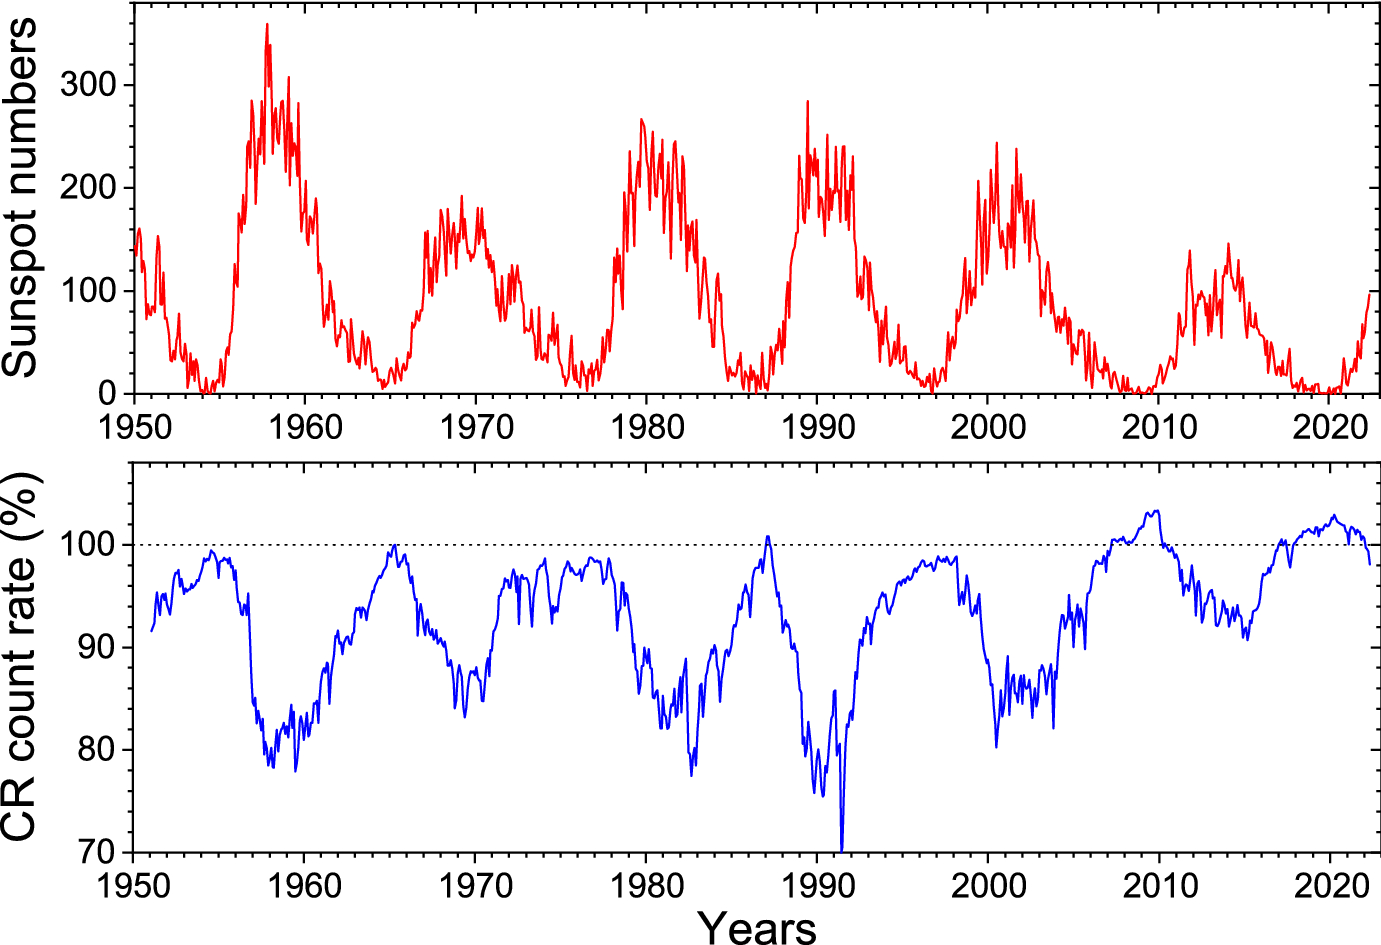
“Cyclic variations since 1951. Panel a: Time profiles of International sunspot number v.2 (http://sidc.be/silso/datafiles); Panel b: Cosmic-ray flux as the count rate of a subpolar neutron monitor (Oulu NM http://cosmicrays.oulu.fi, Climax NM data used before 1964), 100% NM count rate corresponds to May 1965″
After their production in the Earth’s atmosphere, the radionuclides are transported and distributed within the environment and partly stored in natural archives. The best-suited archives are tree rings (14C) and polar ice (10Be) and both have recorded the solar activity signal with high temporal resolution over many millennia. Tree rings and polar ice can both be dated very accurately, which is a prerequisite for high temporal resolution reconstructions. Some existing records have annual resolution for the past ca. 600 years (Berggren et al., 2009), and resolutions of a few years to decades for the Holocene (e.g., Muscheler et al., 2007; Usoskin et al., 2007; Steinhilber et al., 2008). Note that cosmogenic radionuclides are also found in other archives (e.g., alpine glaciers, lake sediments, ocean sediments) but generally the chronologies are less accurate.
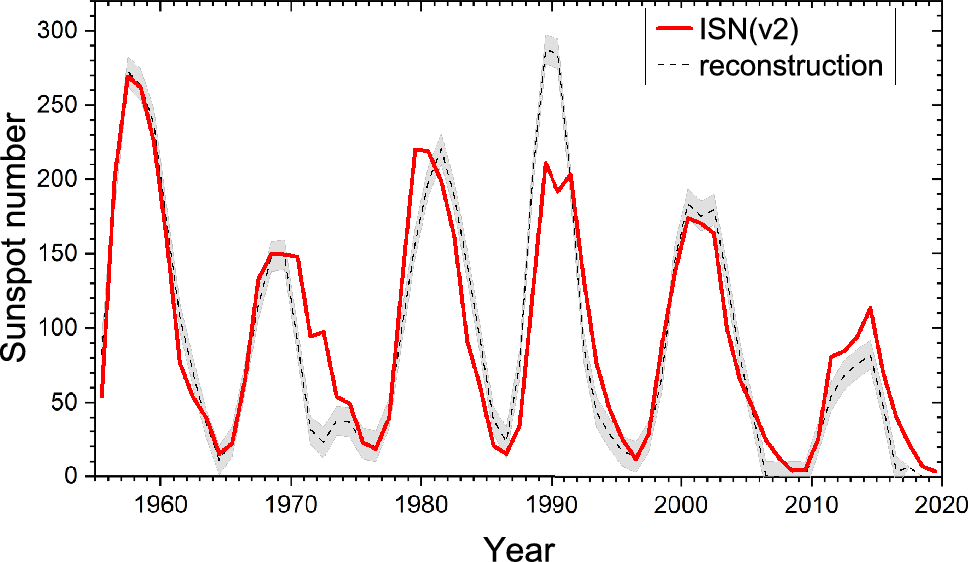
Annual sunspot number since 1955 as provided by the ISN (v2—red curve) and reconstructed from cosmic-ray data measured by neutron monitors (black dashed curve with 1σ uncertanties—Usoskin et al. 2021b) The radionuclide signal not only reflects the cosmic ray variation due to solar and geomagnetic activity, it is also influenced by “system effects”. System effects are variations induced by the transport from the atmosphere where the radionuclides are produced to the ground where they are archived. In addition to the system effects, the cosmic ray signal has uncertainty due to uncertainty in the timescale and in the radionuclide measurements.
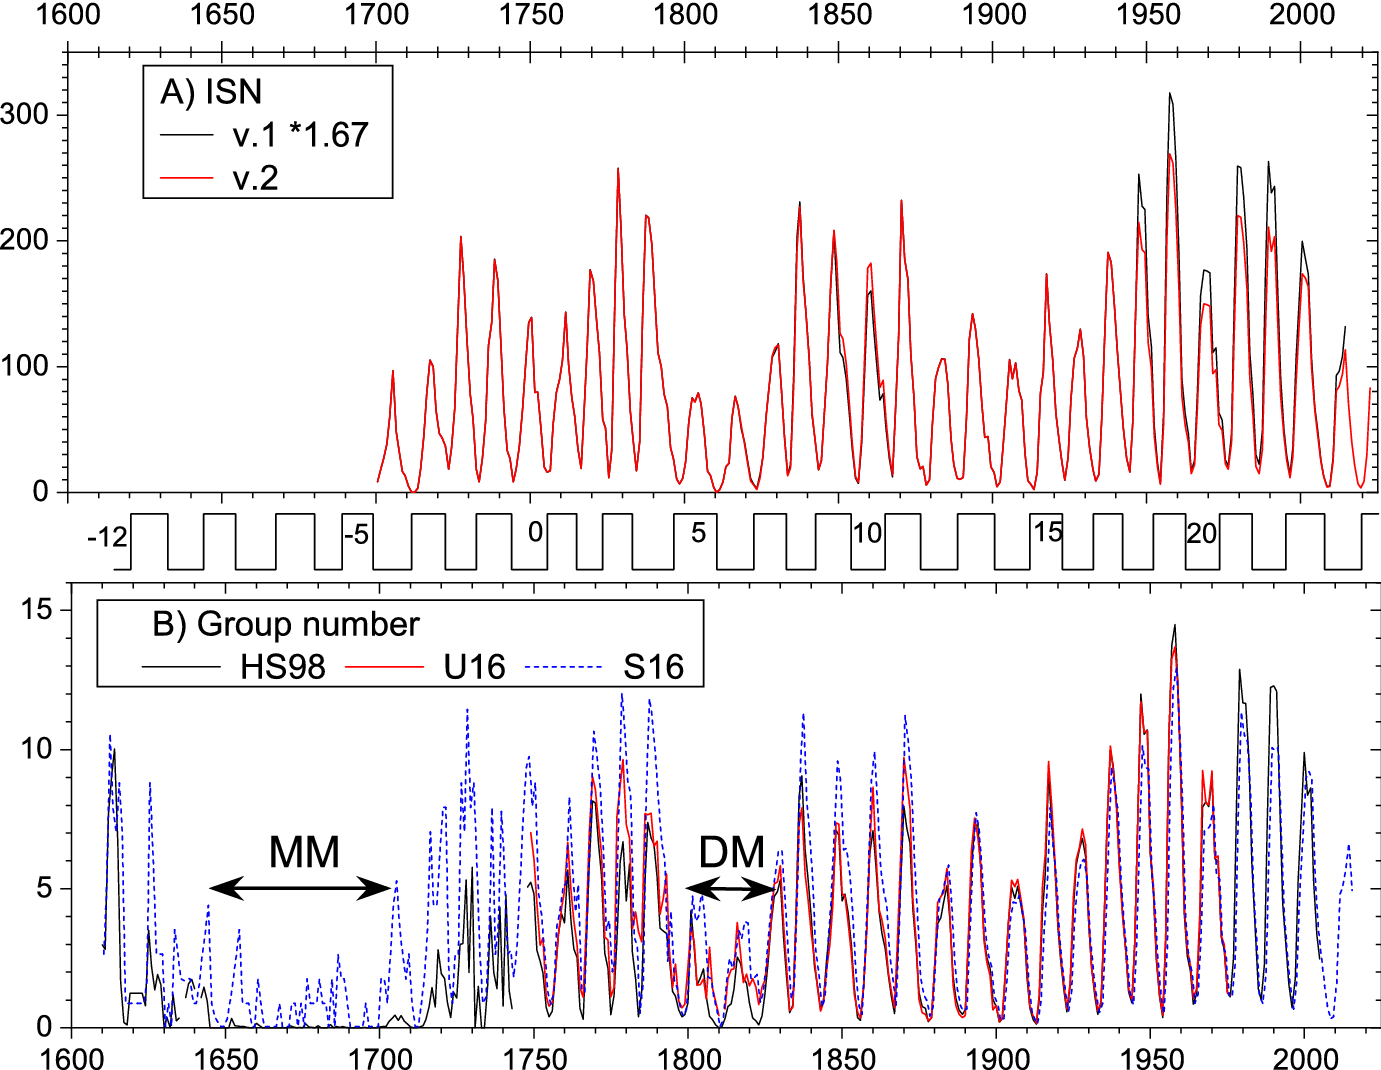
“Annual sunspot activity for the last centuries. a International sunspot number series versions 1 and 2 (the former is scaled with a 1.67 factor, see SILSO at http://sidc.be/silso/datafiles). b Number of sunspot groups: HS98—(Hoyt and Schatten 1998); U16—(Usoskin et al. 2016b); S16—(Svalgaard and Schatten 2016). Standard (Zürich) cycle numbering is shown between the panels. Approximate dates of the Maunder minimum (MM) and Dalton minimum (DM) are shown in the lower panel”
Solar activity during the past 1200 years
Recently, total solar irradiance (TSI) has been reconstructed from a composite of several 10Be records measured in polar ice for the past 9300 years (Steinhilber et al., 2008, 2009). The composite is mainly based on the 10Be record from the GRIP ice core, Greenland. As system effects mostly influence the signal on short time-scales, 40-year averages have been built from the 10Be records. A part of the Holocene TSI reconstruction is shown for the past 1200 years in Figure 1a. Five distinct grand solar minima can be identified known as the Oort (1040-1080 AD), Wolf (1280-1350 AD), Spörer (1460-1550 AD), Maunder (1645-1715 AD), and Dalton (1790-1820 AD) Minima. The last four grand solar minima: Wolf, Spörer, Maunder and Dalton, occurred in a cluster. This cluster coincides with the Little Ice Age (LIA), a period of cold climate conditions from about 1350 to 1850 AD.
Between the Oort and the Wolf Minimum a period of high solar activity of approximately 200 years is evident. This period coincides with the Medieval Climate Anomaly (MCA), which is generally characterized by warmer and drier climate conditions. The simultaneous occurrences of the LIA with a cluster of grand solar minima and of the MCA with a long-lasting period of high solar activity, points to an influence of the Sun on the Earth’s climate during these periods. In addition to solar activity, volcanic eruptions played an important role (Fig. 1b; Gao et al., 2008). During the LIA, several strong volcanic eruptions occurred at the time of grand solar minima, which had a further cooling effect. An inverse pattern is found for the MCA when only weak volcanic eruptions are identified and solar activity was high. With the beginning of industrialization in the 18th century, the importance of solar and volcanic forcing decreased while the influence of the anthropogenic greenhouse effect due to fossil fuel burning began to increase and is currently playing the dominant role (Hegerl et al., 2007).
Future solar activity
An interesting question is what role the Sun is going to play in the near future. The 9300-year long composite of solar activity (Steinhilber et al., 2008) shows that during the past six decades the Sun has been in a state of high solar activity compared to the entire period of 9300 years. The statistics of the occurrence of periods of high activity suggests that the current period of high activity will come to an end in the next decades (Abreu et al., 2008). Furthermore, the distribution of grand solar minima in the past 9300 years shows that it is likely that a Maunder Minimum-like period would occur around 2100 AD (Abreu et al., 2010). Such a period of low solar activity would probably lead to a temporary reduction in Earth’s temperature rise due to the anthropogenic greenhouse effect. However, the 9300-year long record shows that in the past a grand maximum has always been followed by a period of high activity, with the very likely assumption that the Sun’s future behavior will be similar to that of the past, it is clear that the Sun will not permanently compensate for human-made global warming.”
References
Knudsen, M.F., Riisager, P., Donadini, F., Snowball, I., Muschelere, R., Korhonen, K. and Pesonen, L.J., 2008: Variations in the geomagnetic dipole moment during the Holocene and the past 50 kyr, Earth and Planetary Science Letters 272 (1-2): 319-329. doi: 10.1016/j.epsl.2008.04.048
Steinhilber, F., Beer, J. and Frohlich, C., 2009: Total solar irradiance during the Holocene, Geophysical Research Letters 36, doi: 10.1029/2009GL040142.
Gao, C.C., Robock, A. and Ammann, C., 2008: Volcanic forcing of climate over the past 1500 years: An improved ice core-based index for climate models, Journal of Geophysical Research-Atmospheres 113, doi: 10.1029/2008JD010239.
Hegerl, G.C., Zwiers, F.W., Braconnot, P., Gillett, N.P., Luo, Y., Marengo Orsini, J.A., Nicholls, N., Penner, J.E. and Stott, P.A., 2007: Understanding and Attributing Climate Change. In: Solomon, S., et al. (Eds), Climate Change 2007: The Physical Science Basis. Contribution of Working Group I to the Fourth Assessment Report of the Intergovernmental Panel on Climate Change, Cambridge University Press.
Abreu, J.A., Beer, J., Steinhilber, F., Tobias, S.M. and Weiss, N.O., 2008: For how long will the current grand maximum of solar activity persist? Geophysical Research Letters 35, doi: 10.1029/2008GL035442.
FIRST TIME?
https://borderlandsciences.org/journal/vol/56-8/v56-1/Borges_Odic_Observations
https://borderlandsciences.org/journal/vol/56-8/v56-1/Solar_Activity_Cycle23.html
What Is Going On With Our Sun? Are Hysterical Claims Really True?
by M. Theroux and James Borges
“Not since ____ have such violent outbreaks been seen on the surface of the sun as have been reported this year.”
“The quote is from Harlan True Stetson, the date in the blank is August 1917, and the year Stetson wrote this was 1937. It sounds like it could have been written today. I’m a little dismayed at the hysteria being generated by the media about our current solar condition. We seem to be witnessing “grasping at straws” attempts to point the finger at anything suspect of causing total chaos as we approach the new millennium. At first it was Y2k that was supposed to end the world as we know it, and as that died out due to challenges and rational thought from real computer experts and industrialists (note: the computer industry is preparing for sales in the year 2000 — not the end of the world), now the Sun is the most recent victim to blame for our upcoming Armageddon. Mind you, most of these claims are coming from the alternative media, who again treasure alternative media sources for their documentation and confirmation. These media types do not consult scientists who are respected in the fields in which they work, rather they consult with so-called alternative spokespersons, prophets, and pseudo-scientists (yes, I said that dreaded word) who profess “radical changes are a coming” and “head for the hills” mentality.
A classic example of this kind of behavior was presented to us at BSRF last year. We received several faxes from a couple of groups who had claimed that there was an extraordinary seismic event that occurred and had lasted for hours. They suggested that it had originated from deep inside the earth, and was unprecedented in that it was not felt by anyone. They had also suggested that it was probably a precursor to other potentially devastating seismic events. I perused the seismic databases in search of this anomaly and found nothing, so I asked the group if they could provide any data on the event. I received another fax with several seismograms from the internet’s Live Seismic Server which appeared to detail this event with a statement from the group that the USGS was silent on the event — that they may be involved in a coverup. After a quick glance at the seismograms it was easy to correlate the data exactly with a known event that had occurred on the day in question, and that their speculation on the duration of the event had stemmed from their inability to properly interpret the seismograms! Needless to say, after I replied to the group with the correct analysis, it was never mentioned again.
Of course, the USGS was not involved in any coverup — they simply had no idea what these groups were talking about and chalked it up to more lunatic hysteria — as do many mainstream scientists when confronted with such data. I can hardly blame them for their reactions as this is becoming more commonplace as the millennium approaches. Many in the scientific community are being bombarded with allegations of covering up data and research even when they try to present their findings openly. In order for the alternative science community to properly liaison with mainstream science this will have to cease. It is our hope that these attacks do not encourage elements of quantitative science to withhold rather than reveal. So then, what is really happening with our Sun? Is there something unusual and extraordinary about the recent rise in sunspot numbers? Are communications satellites, automobiles, computers, power plants, etc. going to be rendered useless? Is the sun going to explode soon or lash out with a gigantic fireball to consume the earth and her inhabitants? It’s always a possibility, but I don’t think so. There are some things that solar activity might be responsible for, but we’ll check into that a little later.
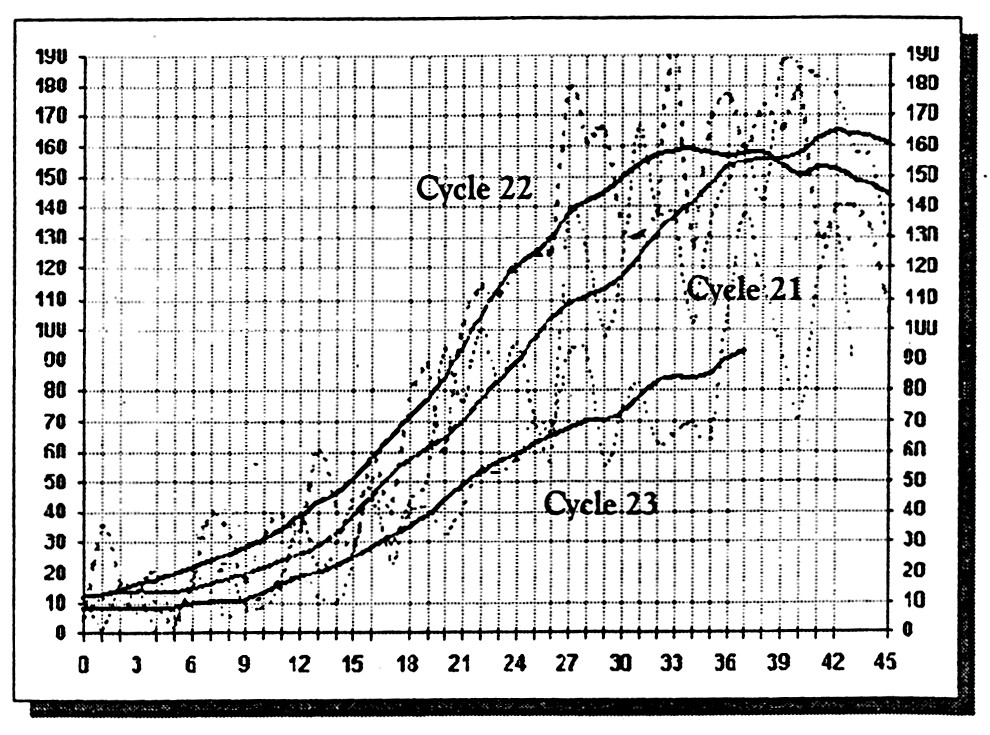
First, let’s look at sunspot activity through recent history. It has been stated by some media personalities that the recent rise in sunspot numbers may be the highest ever recorded — that the jump to over 300 (or 340) is simply unexampled. [note: “Sunspot Number” is comprised of a daily index of SUNSPOT activity (R), defined as R = k (10 g + s) where S = number of individual spots, g = number of sunspot groups, and k is a variable scaling factor (usually < 1)].1 Historical solar and geomagnetic data from 1956-1991 show that unsmoothed sunspots numbers 2 have indeed reached levels and higher many times. Now, let’s look at a graphical comparison of solar cycles 21, 22, and our current Cycle 23 (as of 01-01-00):
 And, here is a graphical comparison of solar cycles 10, 13, 17, 20 and the current Cycle 23 (using the international monthly smoothed sunspot number):
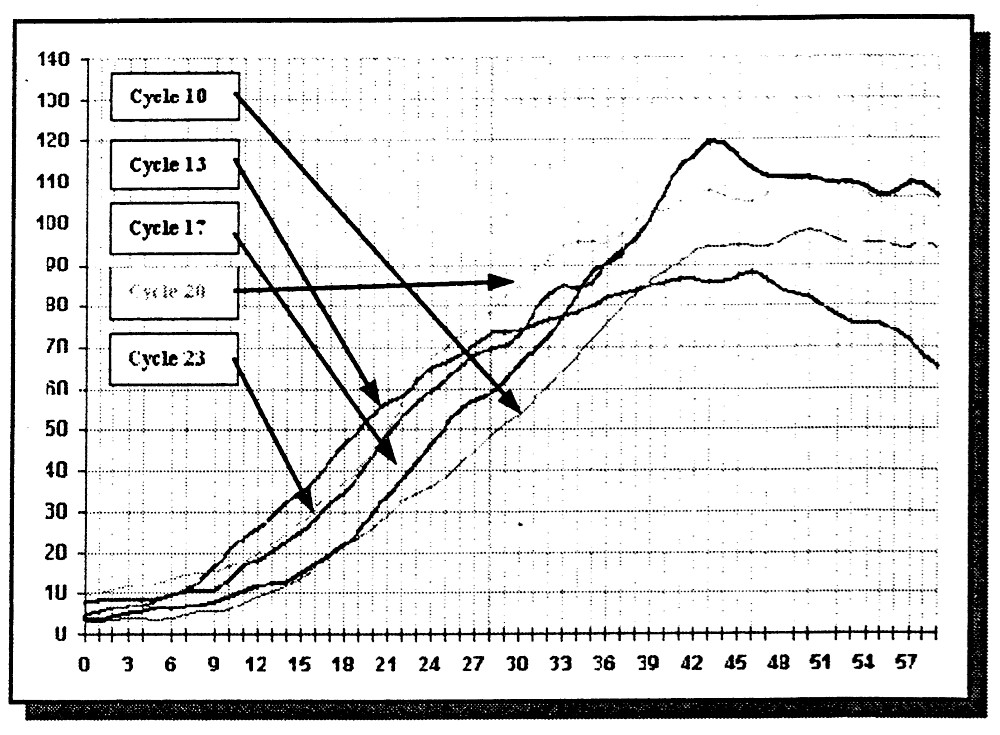
We can see from the above graphs that Cycle 23 (our present cycle) is about average. While Cycle 23 (our present cycle) has been predicted to be slightly above average (See: Cycle 23 Will Be Above Average But No Record Setter 3) where Dr. David Hathaway of NASA’s Marshall Space Flight Center said, “It’s like saying we’re going to have a mild or cold winter.” It is now quite probable that the Earth’s climate may be linked to sunspots. The “Little Ice Age” corresponded with a 70-year period, 1645-1715, when sunspots were thin in number, the Maunder minimum. Also, there are strong statistical associations linking current trends in climate (surface temperatures) to trends in solar activity (See these two excellent papers by Dr. Theodor Landscheidt from the Schroeter Institute for Research in Cycles of Solar Activity, Nova Scotia, Canada entitled, Solar Activity: A Dominant Factor in Climate Dynamics 4, and Solar Activity Controls El Niño and La Niña 5). Now that we have fairly determined that Cycle 23 is not really any different than previous cycles, what is it that the sun will affect, and what is it that we should really concern ourselves with?
Sunspots and Human Behavior
The recent Solar Maximum gives us a wonderful opportunity to observe the Sun in action. Borderland Sciences has been investigating the relationship of the Sun and human behavior for many years, and we are quite confident that we can predict behaviors based on sunspot fluctuations over very short and long durations within the Solar Cycle of 11 years. Historically, research has been conducted to link the 11 year cycle of the sun to changes in human behavior and society. The most famous research had been done by professor A.L. Tchijevsky, a Russian scientist, who presented a paper to the American Meteorological Society at Philadelphia in the late 19th century. He prepared a study of the history of mass human movement compared to the solar cycle, beginning with the division of the Solar cycle into four parts: 1) Minimum sunspot activity; 2) increasing sunspot activity; 3) maximum sunspot activity; 4) Decreasing sunspot activity. He then divided up the agitation of mass human movements into five phases:
- provoking influence of leaders upon masses
- the “exciting” effect of emphasized ideas upon the masses
- the velocity of incitability due to the presence of a single psychic center
- the extensive areas covered by mass movements
- Integration and individualization of the masses
By these comparisons he constructed an “Index of Mass Human Excitability” covering each year from 500 B.C. to 1922 A.D. He investigated the histories of 72 countries in that period, noting signs of human unrest such as wars, revolutions, riots, expeditions and migrations, plus the number of humans involved.
Tchijevsky found that fully 80% of the most significant events occurred during the years of maximum sunspot activity. He maintained that the “exciting” period may be explained by an acute change in the nervous and psychic character of humanity, which takes place at sunspot maxima. Tchijevsky discovered that the solar minimum is the lag period when repression is tolerated by the masses, as if they lacked the vital energy to make the needed changes. He found that during the sunspot maximum, the movement of humans is also at its peak. Tchijevsky’s study is the foundation of sunspot theory on human behavior, and as Harlan True Stetson, in his book Sunspots and Their Effects (available from BSRF), stated, “Until, however, someone can arrive at a more convincing excitability quotient for mass movements than professor Tchijevsky appears yet to have done, scientists will be reluctant to subscribe to all the conclusions which he sets forth.” Stetson did acknowledge that the mechanism by which ultraviolet radiation is absorbed was still a puzzle biologists had to solve. The mechanism behind the stimulation of human behavior is still a mystery, but the theories of Georges Lakhovsky may shed some light.
He considered his book, “The Secret of Life” (reprinted by BSRF), the extension of a scientific hypothesis of a new theory of life. The Sun is one of Earth’s primary sources of cosmic radiation. While the Sun does produce its own radiations, solar winds actually capture passing cosmic dust and radiation and blow it into the earth’s atmosphere. While it may seem frightening to some, this can actually be considered the Primal Vibration that sets the cells vibrating with Vital Force. This is the Prana, that Cosmic Breath, which is meant to vitalize man, and is the source for our evolution.
Dr. George Crile, a distinguished American surgeon, studied the sun in light of its radiant energy. In the ‘Preliminary Remarks’ to Lakhovsky’s The Secret of Life, Professor d’Arsonval quotes Crile: “It is clear that radiation produces the electrical current which operates adaptively the organism as a whole, producing memory, reason, imagination, emotion, the special senses, secretions, muscular action, the response to infection, normal growth, and the growth of benign tumours and cancers, all of which are governed adaptively by the electric charges that are generated by the short wave or ionizing radiation in protoplasm.”
He felt that the entire energy system of living beings is controlled by radiant energy and electrical forces. D’Arsonval points out that Lakhovsky and Crile found that living cells are electrical cells functioning as system of generators, inductance lines, and insulators. The underlying mechanism is the oscillating circuit. An oscillating circuit is a circuit containing inductance and capacity, [31]which when supplied energy from an external source, is set in electrical vibration and oscillates at its natural frequency. D’Arsonval explains further that a conductor is said to possess inductance if a current flowing through it causes a magnetic field to be set up round it. The capacity of a condenser of an isolated body is a measure of the charge of the quantity of electricity it is capable of storing. From such a circuit, energy is readily given off in the form of waves. According to Lakhovsky, the nucleus of a living cell may be compared to an electrical oscillating circuit. The nucleus consists of tubular filaments, chromosomes, mitochondria, made up of insulating material and filled with a conducting fluid containing all the mineral salts found in sea water. These filaments are thus comparable to oscillating circuits endowed with capacity according to a specific frequency.
The cosmic radiation from the Sun is a blessing of Vital Force. As Lakhovsky has postulated, it is the cosmic radiations that give the cells their vibrant oscillations. While the sunspot maxima is occurring, the solar flares and the subsequent geo-magnetic reactions effect the many subtle reactions that take place within our bodies at the atomic level. It has been theorized that this has a direct relationship to the metabolism of the body. We know it is the subtle magnetism of positive and negative charges that pulls certain particles across membranes in cells to produce energy. These magnetic exchanges result in the stimulation of enzymes and the production of energy like ATP. The increase of penetrating waves during a solar storm causes an excitation in these electro-chemical reactions within the body. Tchijevsky also identified correlations between changes in solar magnetic activity with biological processes. In light of Lakhovsky’s theory in his own words, ” . . . with the aid of elementary analogies, that the cell, essential organic unit in all living beings, is nothing but an electromagnetic resonator, capable of emitting and absorbing radiations of very high frequency.”
A plausible mechanism is provided to understanding the stimulating effects the radiation from the Sun has on human behavior. In an abstract entitled “Automated Experiment on Macro-fluctuation Monitoring” Bruns A.V. & Visolimsky B.M. also find a close relationship with the solar activity and bio-chemical reactions. “Phenomenologically obtained data could be treated like an effect of the surface (controlled by solar activity) on the physico-chemical kinetics. This effect was realized, evidently through the mechanisms close to nuclear magnetic resonance in geomagnetic field.” In another historical study Suitbert Ertel writes in his article “Synchronous Bursts of Activity in Independent Cultures; Evidence for Extraterrestrial Connections” that evidence has been reported suggesting a link between historical oscillations of scientific creativity and solar cyclic variation. Eddy’s discovery of abnormal secular periods of solar inactivity (Maunders minimum type) offered the opportunity to put the present hypothesis to a crucial test.
Using time series of flourish years of creators in science, literature, and painting (A.D. 600-1800) It was found as expected: 1) Cultural flourish curves show marked discontinuities (bursts) after the onset of secular solar excursions synchronously in Europe and China; 2) During periods of extended solar excursions, bursts of creativity in painting, literature, and science succeeded one another with lags of about 10-15 years; 3) The reported regularities of cultural output are prominent throughout with eminent creators. They decrease with ordinary professionals. The hypothesized extraterrestrial connection of human culture has thus been strengthened. The evidence seems to show that during the maxima of sunspot activity human behavior is stimulated.
There is some Russian research that shows an increase in cardiac problems during sunspot maxima. The solar activity probably sets off a preexisting condition and no one is suggesting that people will drop dead in the streets. We could see the stress of solar activity on the biology of living things as an evolutionary agent weeding out the old and sick and strengthening those who can resonate with its radiations. In his ‘Preliminary remarks to Lakhovsky’s The Secret of Life the Professor d’Arsonval gives several examples of research done in the last hundred years that shows the most malefic effects from solar activity come at the sunspot minima. He notes from the British Medical Journal, March 7th & 14th of 1936 that both Colonel C.A. Gill and Dr. Conyers Morrel found increases in pandemics of deadly diseases during the period of minimal sunspot activity. In Gill’s study he showed that every pandemic of malaria since sunspot records were taken had occurred when sunspot numbers were lowest. Similar trends were observed in East Africa and elsewhere with Yellow fever epidemics since 1800 occur during the sunspot minima.
Dr. Conyers Morrel also finds that, ” . . . waves of epidemic diseases covering considerable periods exhibit a very close correspondence with the phases of sunspot periods. Diphtheria, Typhus, and Dysentery seemed to prosper when there was an absence of solar activity. We also see an increase in disease in Solco W. Tromp’s study. Without the stimulation from the Sun human health seems to diminish. The immune system seems to grow unresponsive during the solar lull and diseases can more easily gain a foothold in the body. Not only human health but Life itself seems hampered by the lack of solar activity. William Hershel wrote in 1801, “It seems probable analyzing the period between 1650 and 1713, and judging by the normal yields of wheat, that a scarcity of vegetation occurred whenever the sun appeared to be free from spots.” The depressed state of metabolism and lack of food in agricultural centers may have seemed very inviting to the Mongols. Goncharov, in an abstract on the “Asian Nomadic Invasions and Solar Cycles”, aid, “From the 4th to the 16th centuries the Central Asian Steepe was the cradle of the series of great nomadic tribal invasions into agricultural regions of Europe, China, and South Asia. Those invasions had similar features. They arose in middle latitudes and recurred every 160-220 years — exactly after solar abatements.”
References
- http://spaceweather.com/java/archive.html#sunspotnum
- http://dxlc.com/solar/history/
- http://science.nasa.gov/newhome/headlines/ast13apr98_1.htm
- http://microtech.com.au/daly/solar/solar.htm
- http://microtech.com.au/daly/sun-enso/sun-enso.htm
- Moore, Carol. Sunspot Cycles and Activist Strategy, http://kreative.net/carolmoore/sunspot-article.html
- Lakhovsky, Georges. The Secret of Life. BSRF, 1985. [Available in our standard xerographic format: <#B0216, “The Secret of Life”>]
- Petersen, William. Man, Weather, Sun. Charles C. Thomas, 1947. <>
- Stetson, Harlan True. Sunspots in Action. The Ronald Press Company, New York, 1947. [Digital: <http://catalog.hathitrust.org/Record/001485895>]
- Stetson, Harlan True. Sunspots and Their Effects. McGraw-Hill, New York, 1937. [Available in our standard xerographic format: <#B0124, “Sunspots and Their Effects“>]
- Botezat-Antonescu, L., and Predeanu I. “Possible Heliogeophysical Influence on Human Health in Romania” (Abstract). Relations of Biological and Physicochemical Processes with Solar Activity and Other Environmental Factors, 1993.
- Breus T.K., Halberg F. and Cornelissen G. “Effect of the Solar Activity on the Physiological Rhythms of Human Being” (Abstract). Relations of Biological and Physicochemical Processes with Solar Activity and Other Environmental Factors, 1993.
- Ertel, Suitber. Solar Activity and Bursts of Human Creativity, http://knowledge.co.uk/frontiers/sf067p17.html
- Freitas, Robert A., Sunspots and Disease, http://knowledge.co.uk/frontiers/sf034p12.html
- Goncharov, G.G. “Asian Nomads Invasions and Solar Cycles” (Abstract). Relations of Biological and Physicochemical Processes with Solar Activity and Other Environmental Factors, 1993.
PREVIOUSLY
LARGEST SOLAR STORMS in HISTORY (cont.)
https://spectrevision.net/2025/05/15/solar-particle-storms/
SOLAR MAXIMUM
https://spectrevision.net/2024/05/23/solar-maximum/
SPACE WEATHER and REVOLUTIONS
https://spectrevision.net/2018/12/10/space-weather-and-revolutions/
BLACKOUT PARTIES
https://spectrevision.net/2008/08/18/blackout-as-holiday-opportunity/
APOCALYPSE SEX
https://spectrevision.net/2018/10/17/apocalypse-sex/
DISASTER BABIES
https://spectrevision.net/2020/12/25/disaster-babies/