
{Lehman still existed in 2007 dataset used}
http://arxiv.org/abs/1107.5728v2
The network of global corporate control
by Stefania Vitali, James B. Glattfelder & Stefano Battisto
28 Jul 2011 (v1), last revised 19 Sep 2011 (this version, v2)
“The structure of the control network of transnational corporations affects global market competition and financial stability. So far, only small national samples were studied and there was no appropriate methodology to assess control globally. We present the first investigation of the architecture of the international ownership network, along with the computation of the control held by each global player. We find that transnational corporations form a giant bow-tie structure and that a large portion of control flows to a small tightly-knit core of financial institutions. This core can be seen as an economic “super-entity” that raises new important issues both for researchers and policy makers.”

The 1318 transnational corporations that form the core of the economy. Superconnected companies are red, very connected companies are yellow. The size of the dot represents revenue (Image: PLoS One)
a SUPER-ENTITY
http://www.newscientist.com/article/mg21228354.500-revealed–the-capitalist-network-that-runs-the-world.html
Revealed – the capitalist network that runs the world
by Andy Coghlan and Debora MacKenzie / 19 October 2011
AS PROTESTS against financial power sweep the world this week, science may have confirmed the protesters’ worst fears. An analysis of the relationships between 43,000 transnational corporations has identified a relatively small group of companies, mainly banks, with disproportionate power over the global economy. The study’s assumptions have attracted some criticism, but complex systems analysts contacted by New Scientist say it is a unique effort to untangle control in the global economy. Pushing the analysis further, they say, could help to identify ways of making global capitalism more stable.
The idea that a few bankers control a large chunk of the global economy might not seem like news to New York’s Occupy Wall Street movement and protesters elsewhere. But the study, by a trio of complex systems theorists at the Swiss Federal Institute of Technology in Zurich, is the first to go beyond ideology to empirically identify such a network of power. It combines the mathematics long used to model natural systems with comprehensive corporate data to map ownership among the world’s transnational corporations (TNCs). “Reality is so complex, we must move away from dogma, whether it’s conspiracy theories or free-market,” says James Glattfelder. “Our analysis is reality-based.” Previous studies have found that a few TNCs own large chunks of the world’s economy, but they included only a limited number of companies and omitted indirect ownerships, so could not say how this affected the global economy – whether it made it more or less stable, for instance.
The Zurich team can. From Orbis 2007, a database listing 37 million companies and investors worldwide, they pulled out all 43,060 TNCs and the share ownerships linking them. Then they constructed a model of which companies controlled others through shareholding networks, coupled with each company’s operating revenues, to map the structure of economic power. The work, to be published in PloS One, revealed a core of 1318 companies with interlocking ownerships (see image). Each of the 1318 had ties to two or more other companies, and on average they were connected to 20. What’s more, although they represented 20 per cent of global operating revenues, the 1318 appeared to collectively own through their shares the majority of the world’s large blue chip and manufacturing firms – the “real” economy – representing a further 60 per cent of global revenues.
When the team further untangled the web of ownership, it found much of it tracked back to a “super-entity” of 147 even more tightly knit companies – all of their ownership was held by other members of the super-entity – that controlled 40 per cent of the total wealth in the network. “In effect, less than 1 per cent of the companies were able to control 40 per cent of the entire network,” says Glattfelder. Most were financial institutions. The top 20 included Barclays Bank, JPMorgan Chase & Co, and The Goldman Sachs Group.
John Driffill of the University of London, a macroeconomics expert, says the value of the analysis is not just to see if a small number of people controls the global economy, but rather its insights into economic stability. Concentration of power is not good or bad in itself, says the Zurich team, but the core’s tight interconnections could be. As the world learned in 2008, such networks are unstable. “If one [company] suffers distress,” says Glattfelder, “this propagates.” “It’s disconcerting to see how connected things really are,” agrees George Sugihara of the Scripps Institution of Oceanography in La Jolla, California, a complex systems expert who has advised Deutsche Bank.
Yaneer Bar-Yam, head of the New England Complex Systems Institute (NECSI), warns that the analysis assumes ownership equates to control, which is not always true. Most company shares are held by fund managers who may or may not control what the companies they part-own actually do. The impact of this on the system’s behaviour, he says, requires more analysis. Crucially, by identifying the architecture of global economic power, the analysis could help make it more stable. By finding the vulnerable aspects of the system, economists can suggest measures to prevent future collapses spreading through the entire economy. Glattfelder says we may need global anti-trust rules, which now exist only at national level, to limit over-connection among TNCs. Bar-Yam says the analysis suggests one possible solution: firms should be taxed for excess interconnectivity to discourage this risk. One thing won’t chime with some of the protesters’ claims: the super-entity is unlikely to be the intentional result of a conspiracy to rule the world. “Such structures are common in nature,” says Sugihara.
Newcomers to any network connect preferentially to highly connected members. TNCs buy shares in each other for business reasons, not for world domination. If connectedness clusters, so does wealth, says Dan Braha of NECSI: in similar models, money flows towards the most highly connected members. The Zurich study, says Sugihara, “is strong evidence that simple rules governing TNCs give rise spontaneously to highly connected groups”. Or as Braha puts it: “The Occupy Wall Street claim that 1 per cent of people have most of the wealth reflects a logical phase of the self-organising economy.” So, the super-entity may not result from conspiracy. The real question, says the Zurich team, is whether it can exert concerted political power. Driffill feels 147 is too many to sustain collusion. Braha suspects they will compete in the market but act together on common interests. Resisting changes to the network structure may be one such common interest.
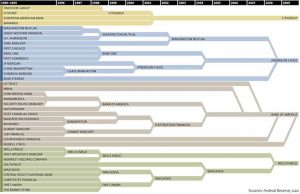
The top 50 of the 147 superconnected companies
1. Barclays plc
2. Capital Group Companies Inc
3. FMR Corporation
4. AXA
5. State Street Corporation
6. JP Morgan Chase & Co
7. Legal & General Group plc
8. Vanguard Group Inc
9. UBS AG
10. Merrill Lynch & Co Inc
11. Wellington Management Co LLP
12. Deutsche Bank AG
13. Franklin Resources Inc
14. Credit Suisse Group
15. Walton Enterprises LLC
16. Bank of New York Mellon Corp
17. Natixis
18. Goldman Sachs Group Inc
19. T Rowe Price Group Inc
20. Legg Mason Inc
21. Morgan Stanley
22. Mitsubishi UFJ Financial Group Inc
23. Northern Trust Corporation
24. Société Générale
25. Bank of America Corporation
26. Lloyds TSB Group plc
27. Invesco plc
28. Allianz SE 29. TIAA
30. Old Mutual Public Limited Company
31. Aviva plc
32. Schroders plc
33. Dodge & Cox
34. Lehman Brothers Holdings Inc*
35. Sun Life Financial Inc
36. Standard Life plc
37. CNCE
38. Nomura Holdings Inc
39. The Depository Trust Company
40. Massachusetts Mutual Life Insurance
41. ING Groep NV
42. Brandes Investment Partners LP
43. Unicredito Italiano SPA
44. Deposit Insurance Corporation of Japan
45. Vereniging Aegon
46. BNP Paribas
47. Affiliated Managers Group Inc
48. Resona Holdings Inc
49. Capital Group International Inc
50. China Petrochemical Group Company
* Lehman still existed in the 2007 dataset used
http://blogs.scientificamerican.com/observations/2011/08/08/ownership-ties-among-global-corporations-strangely-resemble-a-bow-tie/
Ownership Ties Among Global Corporations Strangely Resemble a Bow Tie
by Sophie Bushwick / August 8, 2011
Large international corporations can control a wide variety of smaller companies. For example, Scientific American is a publication of Nature Publishing Group, which is a subsidiary of the Georg Von Holtzbrinck Publishing Group in Germany. This group also owns a number of other publishers in the U.S., United Kingdom, and Germany, a pyramid that includes American suspense thrillers, British textbooks, a German weekly newspaper and more. But corporate pyramids like that of the Von Holtzbrinck Publishing Group do not stand alone: The web of relationships among companies is tangled and complex, as a July 28 paper published to pre-print blogarXiv.org reveals.
A team of ETH Zurich (Swiss Federal Institute of Technology Zurich) researchers used a network model to map the ownership relations among more than 43,000 transnational corporations, which do not identify themselves with one country but rather use a global perspective and employ an international roster of executives. Owning shares in a company grants the owner some direct control of that entity, and indirect control of any companies in the parent-company’s pyramid. By treating each major corporation as a node and drawing links between companies that owned shares of others, the researchers uncovered the tendrils of control that link one pyramid to another.

The links between nodes, shown above, represent influence that can flow two ways: any corporation could either influence or be influenced by any other corporation. Directly owning shares of a company gave a corporation more influence than indirect ownership, and the researchers assigned their links certain weights to reflect this difference. At first glance, the picture that emerged looks quite convoluted. However, the researchers discovered that the web of connections clustered into four different components that took the shape of a bow tie. In the illustration, red dots represent nodes, green arrows point from share-owner to the owned company, and the flow of control points in the direction of the most power.

The researchers observed a central cluster in which influence goes both ways between all the nodes, called the strongly connected component, or SCC, as shown above. Within the SCC, each member either directly or indirectly owns some of every other member’s shares. Second, there was the in group, companies that owned shares in various members of the SCC, but were not under the SCC’s influence: Influence “flowed” in but not out. Part three was the in-group’s opposite, the companies who were influenced by, but did not own shares in, the SCC companies—this became the out group. Finally, the fourth component of the network consists of the tubes and tendrils, or T&T, companies that remain separate from the SCC but may have ties to members of the in or out groups. The above illustration actually represents a generic version of a bow tie network, a category of network that can also be used to describe how Web pages are related. The researchers found that the corporate network looked more like the illustration below, which shows that the out group is much larger than the in group or even the SCC.

Only the tiny, elite in group gets to influence the SCC core without submitting to its influence at all. A significant amount of the corporations, however, still fall into the central strongly connected component, which indicates that many of the major market players have complex economic relationships with one another. “What are the implications for global financial stability?” said the researchers in their paper. “What are the implications for market competition?” The study may not have uncovered a corporate conspiracy, but it does show that corporations are not lone behemoths: They are inter-dependent and influence one another a great deal. Applying a scientific model to the market can help provide a clearer picture of how the world economy runs. And perhaps a hint at what our corporate overlords are wearing.
Image credit: Stefano Battiston et al., ETH Zurich (Swiss Federal Institute of Technology Zurich)

WAIT WHAT DO THEY DO for MONEY?
http://www.newdeal20.org/2011/10/14/who-are-the-1-and-what-do-they-do-for-a-living-61759/
Who are the 1% and What Do They Do for a Living?
by Mike Konczal / 10/14/2011
There’s good reason to focus on the top 1%: they’re distorting our economy.
A lot of emphasis is on the “99%” versus the “1%” in these protests. But who are the 1% and what do they do for a living? Are they all Wilt Chamberlains and Oprahs and other people taking part in the dynamism of the new economy? Nope. It’s same as it ever was — high-level management and the financial sector. Suzy Khimm goes through the numbers here. I’m curious about occupations. I’ll hand the mic off to “Jobs and Income Growth of Top Earners and the Causes of Changing Income Inequality: Evidence from U.S. Tax Return Data“ by Bakija, Cole, and Heim. This is the latest and greatest report on occupations and inequality. Here’s a chart of the occupations of the top 1%:

Inequality has fractals. Let’s go into the top 0.1% — what do they look like? Here’s the chart of the occupations of the top 0.1%, including capital gains:
 It boils down to managers, executives, and people who work in finance. From the paper: “[o]ur findings suggest that the incomes of executives, managers, supervisors, and financial professionals can account for 60 percent of the increase in the share of national income going to the top percentile of the income distribution between 1979 and 2005.”
For fun, there are more than twice as many people listed as “Not working or deceased” than are in “arts, media, sports.” For every elite sports player who earned a place at the top of the income pyramid due to technology changes and superstar, tournament-style labor markets that broadcast him across the globe, there are two trust fund babies.
The top 1% of managers and executives often means C-level employees, especially CEOs. And their earnings versus the average worker have skyrocketed in the past 30 years, so this shouldn’t be surprising:

How has this evolved over time? Can we get a cross-section of that protest sign above?

Same candidates. There’s a reason the protests ended up on Wall Street: The top 1% and top 0.1% comprises all the senior bosses and the financial sector. One of the best things about Occupy Wall Street is that there is no chatter about Obama or Perry or whatever is the electoral political issue of the day. There are a lot of people rethinking things, discussing, learning, and conceptualizing the kinds of world they want to create. Since so much about inequality is a function of the legal structure known as a “corporation,” I’d encourage you to check out Alex Gourevitch on how the corporate is structured in our laws.
The paper notes that stock market returns drive much of the manager’s income. This is related to a process of financialization, something JW Mason has done a fantastic job outlining here. The “dominant ethos among managers today is that a business exists only to enrich its shareholders, including, of course, senior managers themselves,” and this is done by paying out more in dividends that is earned in profits. Think of it as our-real-economy-as-ATM-machine, cashing out wealth during the good times and then leaving workers and the rest of the real economy to deal with the aftermath.
Both articles mention chapter 6 of Doug Henwood’s Wall Street; anyone interested in how things have changed and where they need to go would be wise to check it out. It’s even available for free pdf book download here.
There’s good reason to focus on the top 1% instead of the top 10 or 50%. There is evidence that financial pay at this elite level is correlated with deregulation and the other legal changes that brought on the crisis. High-ranking senior corporate executives’ pay has dwarfed workers’ salaries, but is only a reward for engaging in shady financial engineering practices. These problems require a legal solution and thus they require a democratic challenge and a rethinking of how we want to structure our economy. Here’s to the 99% and Occupy Wall Street helping get us there.
{Mike Konczal is a Fellow at the Roosevelt Institute.}
BLACKROCK
http://www2.blackrock.com/global/home/AboutUs/History/index.htm
VANGUARD
https://personal.vanguard.com/us/content/Home/WhyVanguard/AboutVanguardWhoWeAreContent.jsp
FIDELITY
http://jobs.fidelity.com/ourculture/ourvalues/ourvalue_fidvalue.shtml
FOUR COMPANIES RUN EVERYTHING
http://english.pravda.ru/business/finance/18-10-2011/119355-The_Large_Families_that_rule_the_world-0/
The Large Families that rule the world / 18.10.2011
We are speaking of 6, 8 or maybe 12 families who truly dominate the world. Know that it is a mystery difficult to unravel. But what are the names of the families who run the world and have control of states and international organizations like the UN, NATO or the IMF?
To try to answer this question, we can start with the easiest: inventory, the world’s largest banks, and see who the shareholders are and who make the decisions. The world’s largest companies are now: Bank of America, JP Morgan, Citigroup, Wells Fargo, Goldman Sachs and Morgan Stanley. Let us now review who their shareholders are.
Bank of America:
State Street Corporation, Vanguard Group, BlackRock, FMR (Fidelity), Paulson, JP Morgan, T. Rowe, Capital World Investors, AXA, Bank of NY, Mellon.
JP Morgan:
State Street Corp., Vanguard Group, FMR, BlackRock, T. Rowe, AXA, Capital World Investor, Capital Research Global Investor, Northern Trust Corp. and Bank of Mellon.
Citigroup:
State Street Corporation, Vanguard Group, BlackRock, Paulson, FMR, Capital World Investor, JP Morgan, Northern Trust Corporation, Fairhome Capital Mgmt and Bank of NY Mellon.
Wells Fargo:
Berkshire Hathaway, FMR, State Street, Vanguard Group, Capital World Investors, BlackRock, Wellington Mgmt, AXA, T. Rowe and Davis Selected Advisers.
We can see that now there appears to be a nucleus present in all banks: State Street Corporation, Vanguard Group, BlackRock and FMR (Fidelity). To avoid repeating them, we will now call them the “big four”
Goldman Sachs:
“The big four,” Wellington, Capital World Investors, AXA, Massachusetts Financial Service and T. Rowe.
Morgan Stanley:
“The big four,” Mitsubishi UFJ, Franklin Resources, AXA, T. Rowe, Bank of NY Mellon e Jennison Associates. Rowe, Bank of NY Mellon and Jennison Associates.
We can just about always verify the names of major shareholders. To go further, we can now try to find out the shareholders of these companies and shareholders of major banks worldwide.
Bank of NY Mellon:
Davis Selected, Massachusetts Financial Services, Capital Research Global Investor, Dodge, Cox, Southeatern Asset Mgmt. and … “The big four.”
State Street Corporation (one of the “big four”):
Massachusetts Financial Services, Capital Research Global Investor, Barrow Hanley, GE, Putnam Investment and … The “big four” (shareholders themselves!).
BlackRock (another of the “big four”):
PNC, Barclays e CIC.
Who is behind the PNC? FMR (Fidelity), BlackRock, State Street, etc. And behind Barclays? BlackRock
And we could go on for hours, passing by tax havens in the Cayman Islands, Monaco or the legal domicile of Shell companies in Liechtenstein. A network where companies are always the same, but never a name of a family.
In short: the eight largest U.S. financial companies (JP Morgan, Wells Fargo, Bank of America, Citigroup, Goldman Sachs, U.S. Bancorp, Bank of New York Mellon and Morgan Stanley) are 100% controlled by ten shareholders and we have four companies always present in all decisions: BlackRock, State Street, Vanguard and Fidelity.
In addition, the Federal Reserve is comprised of 12 banks, represented by a board of seven people, which comprises representatives of the “big four,” which in turn are present in all other entities.
In short, the Federal Reserve is controlled by four large private companies: BlackRock, State Street, Vanguard and Fidelity. These companies control U.S. monetary policy (and world) without any control or “democratic” choice. These companies launched and participated in the current worldwide economic crisis and managed to become even more enriched.
To finish, a look at some of the companies controlled by this “big four” group:
Alcoa Inc.
Altria Group Inc.
American International Group Inc.
AT&T Inc.
Boeing Co.
Caterpillar Inc.
Coca-Cola Co.
DuPont & Co.
Exxon Mobil Corp.
General Electric Co.
General Motors Corporation
Hewlett-Packard Co.
Home Depot Inc.
Honeywell International Inc.
Intel Corp.
International Business Machines Corp
Johnson & Johnson
JP Morgan Chase & Co.
McDonald’s Corp.
Merck & Co. Inc.
Microsoft Corp.
3M Co.
Pfizer Inc.
Procter & Gamble Co.
United Technologies Corp.
Verizon Communications Inc.
Wal-Mart Stores Inc.
Time Warner
Walt Disney
Viacom
Rupert Murdoch’s News Corporation.,
CBS Corporation
NBC Universal
The same “big four” control the vast majority of European companies counted on the stock exchange. In addition, all these people run the large financial institutions, such as the IMF, the European Central Bank or the World Bank, and were “trained” and remain “employees” of the “big four” that formed them. The names of the families that control the “big four”, never appear.
{Translated from the Portuguese version by Lisa Karpova / Pravda.Ru}
